

Industrial Plant Cost Indexes
Check the Best Tools to Adjust the Construction Cost of Plants Over Time
Plant cost indexes are multipliers employed to update the capital cost required to erect an industrial plant. By tracking changes in construction costs over time, such indexes are handy tools to quickly estimate capital costs of industrial plants.
Plant cost indexes are typically published on a regular basis, often monthly or quarterly. Changes in the indexes over time indicate the relative increase or decrease in costs compared to the reference period. For example, if the index value for a particular year is 120, it indicates that the costs have increased by 20% compared to the reference period.
There are different indexes, which are suitable for specific industries or sectors. The three main indexes for updating construction costs of industrial plants are the following:
-
Intratec Plant Construction Indexes (IC Indexes)
-
Nelson-Farrar Indexes (NF Indexes)
-
Chemical Engineering Plant Cost Indexes (CEPCI)
This article describes main plant cost indexes and provides a brief comparison of them, highlighting key differences.
1. Intratec Plant Construction Indexes (IC Indexes)
Intratec offers its Plant Construction Indexes (IC Indexes) — today part of its Industry Economics & Competitiveness subscription — which allow users to update construction costs of industrial plants in multiple countries.
IC Indexes are unique in the sense that they can be used for adjusting construction costs of plants located in the 33 countries covered by the Industry Economics & Competitiveness program, not only the USA.
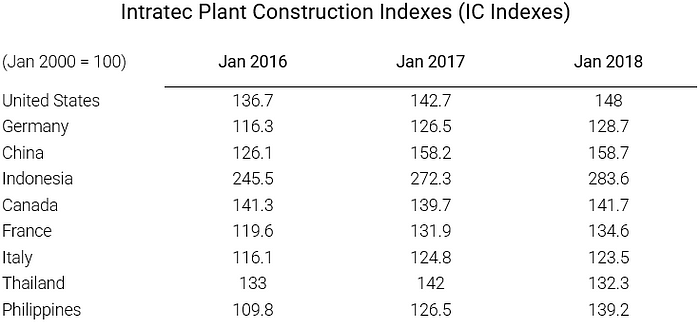
IC Indexes are available as part of the Industry Economics & Competitiveness subscription:
Industry Economics & Competitiveness
Also, unlike CEPCI and other plant cost indexes which cover only historical data, IC Indexes cover near-term forecasts as well. Covering historical figures and forecasts, the IC Indexes are straightforward, handy tools for a series of purposes, like cost estimation, feasibility studies and investment analysis
Intratec Plant Construction Indexes are based on a robust methodology, which involves gathering and processing a large amount of data from various countries related to plant construction. This data includes indexes, prices, and costs associated with steel, energy, equipment, machinery, materials, labor, and engineering services.
2. Nelson-Farrar Indexes (NF Indexes)
The Nelson-Farrar Indexes, often referred to as the NF Indexes or NF, are widely used indicators in the petroleum industry for measuring the relative cost of oil refinery construction, expansion, and maintenance. These indexes provide a means of comparing the costs of petroleum refinery projects across different regions and time periods. NF Indexes are calculated based on a basket of cost components that reflect the expenses associated with building and operating an oil refinery. Such indexes were published monthly in the Oil & Gas Journal, until 2017.
3. Chemical Engineering Plant Cost Indexes (CEPCI)
The Chemical Engineering Plant Cost Indexes are a set of indexes that track the costs of constructing chemical plants and equipment in the United Sates. Published monthly in the Chemical Engineering Magazine, the indexes are composed of various sub-indexes representing different cost components. The composite CEPCI index captures the overall cost trend, while sub-indexes focus on specific cost areas like equipment, labor, materials, construction, and engineering services.
These indexes provide a means of estimating the capital investment required for chemical engineering projects and serve as tools for cost estimation and economic analysis in the chemical process industry.
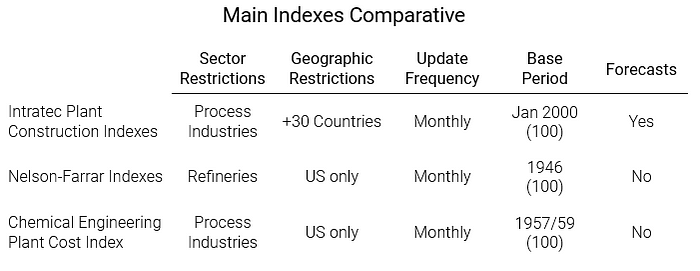
Plant Cost Indexes Comparative
The table below summarizes differences among the main plant cost indexes approached as well as key features.
Using Plant Cost Indexes
The usage of plant cost indexes is straightforward. To update the construction cost of an industrial plant from date A to date B, for instance, one just have to multiply date A’s cost by the ratio of date B’s index over date A’s index, as follows:
Plant Cost[date B] = Plant Cost[date A] × (Index[date B] / Index[date A])
Example. By way of illustration, let’s examine a case in which IC Indexes are used to update construction costs of an industrial plant located in the US. Assume a research group would like to examine the construction cost trend of a chlor-alkali plant in April 2017 in the United States. In a paper, the cost of a similar plant was estimated at USD 100 million in January 2016 in the same country.
To update the plant cost from January 2016 to April 2017, just multiply the plant cost by the ratio of IC Index at April 2017 (145.1) over the IC index in January 2016 (136.7), as expressed in the equation below:
Plant Cost[Apr 2017] = Plant Cost[Jan 2016] × (IC Index[Apr 2017] / IC Index[Jan 2016])
By applying this calculation, the plant cost in April 2017 would be approximately USD 106.1 million.
About Intratec Solutions
Intratec Solutions — Independent Commodity, Energy & Industrial Intelligence. In operation since 2002, Intratec turns complex commodity and industrial data into clear, comparable intelligence. Its AI-enabled products cover prices, market dynamics, production economics, and the broader conditions that shape competitiveness. More at intratec.us.